
Modern market analysis draws on a surprisingly wide toolkit — from century-old descriptive statistics to machine learning models built for today’s high-frequency data streams. The Stock Market Analytics Glossary catalogs a broad range of analytical techniques used across trading, research, and risk functions, and a quick pass through its “Stats Glossary” sheet gives a bird’s-eye view of how that toolkit breaks down. Here’s what it reveals.
A Glossary Built on Five Pillars
At the highest level, every entry in the glossary is tagged with an Analytics Layer — the broad category of technique it belongs to. Five layers make up the toolkit:
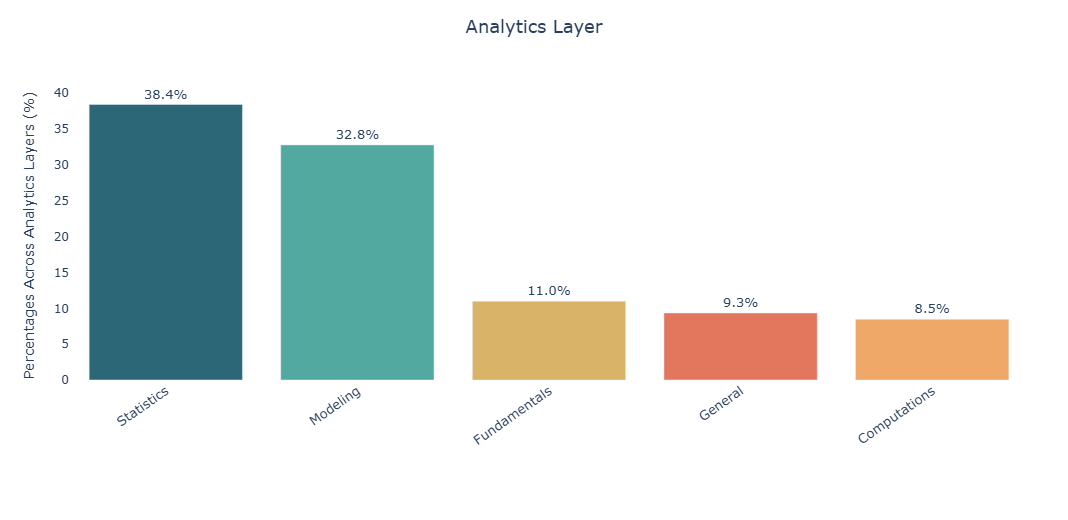
Statistics and Modeling together account for roughly seven out of every ten fields in the glossary, underscoring that market analysis is still fundamentally a statistical discipline — even as modeling approaches expand its reach almost as far. Fundamentals, General technique, and Computations round out the remaining third, giving the glossary a broader footing than a pure “stats-only” toolkit.
The 39 Categories Underneath
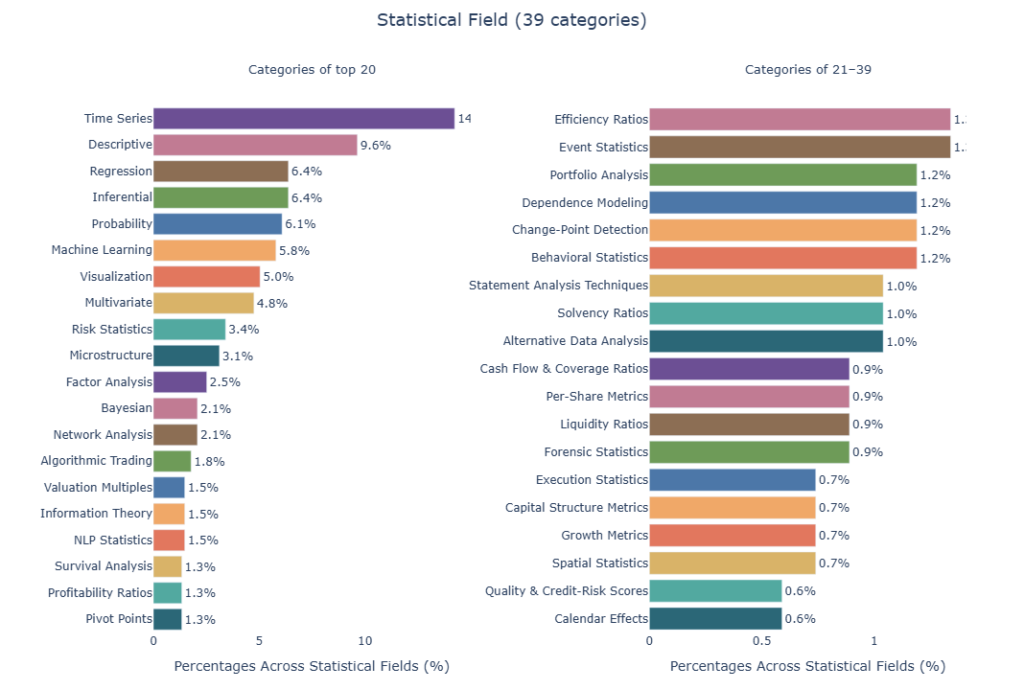
Zooming in one level, the glossary organizes its fields into 39 statistical-field categories. A handful of categories carry outsized weight:
- Time Series leads the pack, making up roughly 14.2% of all fields — the single largest category, reflecting how central sequential, time-ordered data is to market analysis (trend detection, seasonality, forecasting, and more).
- Descriptive statistics follow at about 9.6%, the foundational tools (means, variances, distributions) analysts reach for first.
- Regression and Inferential statistics are tied at roughly 6.4% each, covering the techniques used to model relationships and draw conclusions from data.
- Probability (about 6.1%), Machine Learning (about 5.8%), and Visualization (about 5.0%) round out the next tier, signaling a healthy balance between classical statistical inference, data-driven modeling, and the tools used to communicate results.
At the other end of the spectrum, niche but important categories like Quality & Credit-Risk Scores and Calendar Effects (each 0.6%), and Growth Metrics, Capital Structure Metrics, Execution Statistics, and Spatial Statistics (each 0.8%) show where the glossary covers more specialized corners of market analysis — credit scoring, seasonal anomalies, trade execution quality, and geographically-dependent effects, respectively.
What the Analysis Is For: 15 Analysis Types
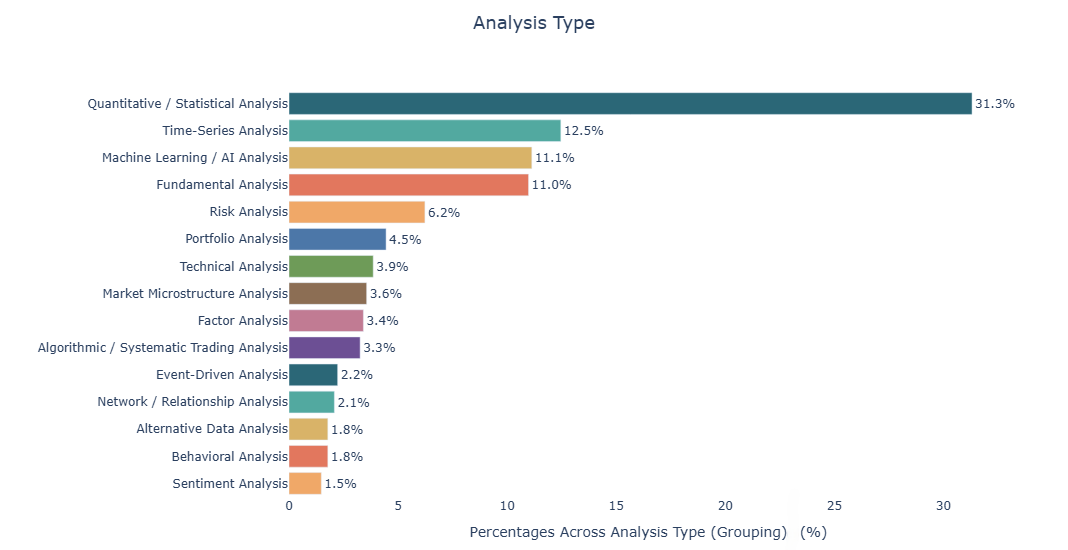
A third lens in the glossary groups the same fields by Analysis Type — essentially, what kind of question or application each technique serves. This view tells a different story:
- Quantitative / Statistical Analysis is by far the largest grouping, at roughly 31.3% of the glossary — nearly a third of all entries support this single analysis type.
- Time-Series Analysis is the next largest at about 12.5%, followed by Machine Learning / AI Analysis at around 11.1% and Fundamental Analysis at about 11.0%.
- Risk Analysis (about 6.2%) and Portfolio Analysis (about 4.5%) reflect the glossary’s coverage of investment management use cases, not just raw statistical technique.
- Smaller but notable groupings include Sentiment Analysis (about 1.5%), Alternative Data Analysis and Behavioral Analysis (about 1.8% each), and Network / Relationship Analysis (about 2.1%) — areas that have grown in relevance as markets increasingly incorporate unconventional data sources and interconnected-asset modeling.
Who Owns the Knowledge: Subject Matter Expertise
The glossary also tags each field with a primary subject-matter-expert (SME) domain, revealing the disciplinary roots of its techniques:
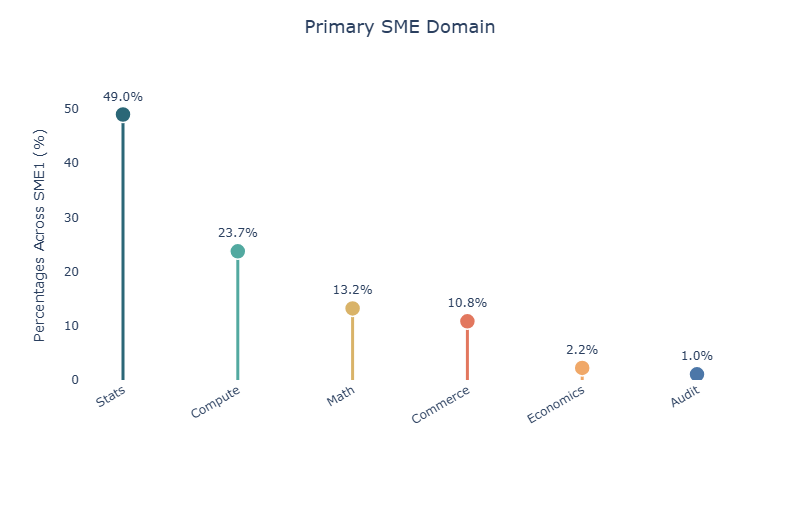
Roughly half the glossary sits squarely within classical statistics expertise, while computational/programming know-how (Compute, roughly 24%) is the second-largest requirement — a reminder that implementing modern market analytics increasingly requires coding and computational skill alongside statistical theory. Math, Commerce, Economics, and Audit, while smaller in share, anchor the glossary’s techniques back to real-world market structure, business context, and controls.
Where the Numbers Come From: Data Sources
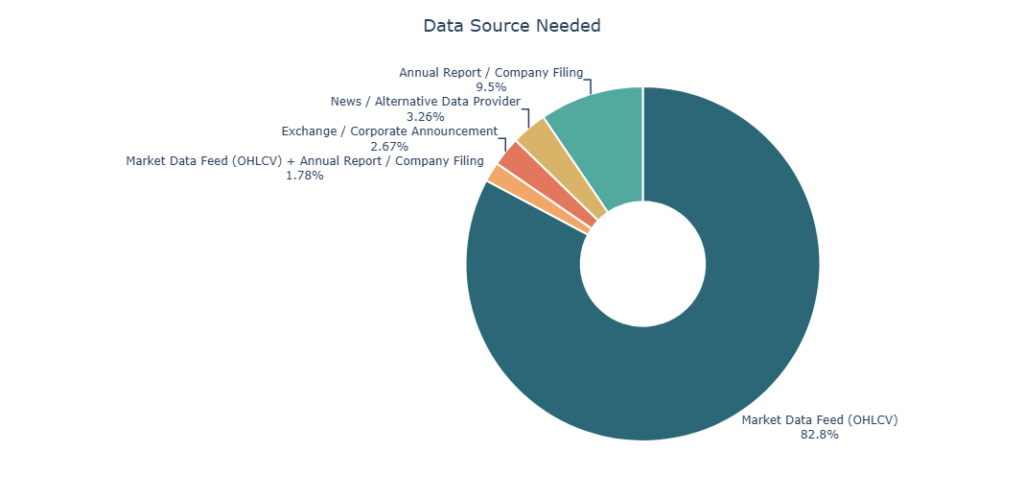
Every technique in the glossary is also tagged with the data it needs to compute. Market Data Feed (OHLCV) — exchange or vendor price/volume data — underpins the large majority of entries, with Annual Report / Company Filing data a distant second, and smaller slices requiring Exchange / Corporate Announcements, News / Alternative Data, or a blend of market data and filings for valuation-style metrics. This lopsided distribution is a useful reality check: most of the glossary can be computed from a single OHLCV feed, and only a minority of techniques require pulling in filings, announcements, or alternative data.
Key Takeaways
Three themes emerge from this summary data:
- Statistics remains the backbone. Whether measured by Analytics Layer (38%), SME domain (49%), or category depth (Time Series, Descriptive, Regression, and Inferential all in the top tier), classical statistical technique is still the largest single pillar of market analysis.
- Time and sequence matter most. Time Series is the largest individual category (about 14% of all fields) and Time-Series Analysis is the second-largest analysis type (about 12.5%) — a strong signal that most market questions ultimately reduce to “how does this change over time?”
- Computation and modeling are catching up. With Modeling making up 33% of the Analytics Layer breakdown and Compute accounting for 24% of SME domains, the glossary shows a discipline in transition — one where coding and algorithmic modeling are becoming as essential as traditional statistical training.
Together, this data sketches a discipline that spans a century of statistical theory and the newest wave of computational, machine-learning-driven approaches — a genuinely full-spectrum toolkit for understanding markets.